
CoachGregAdams
The Coach Gang discusses the Free Agent Lifestyle
Interested? Want to learn more about the community?
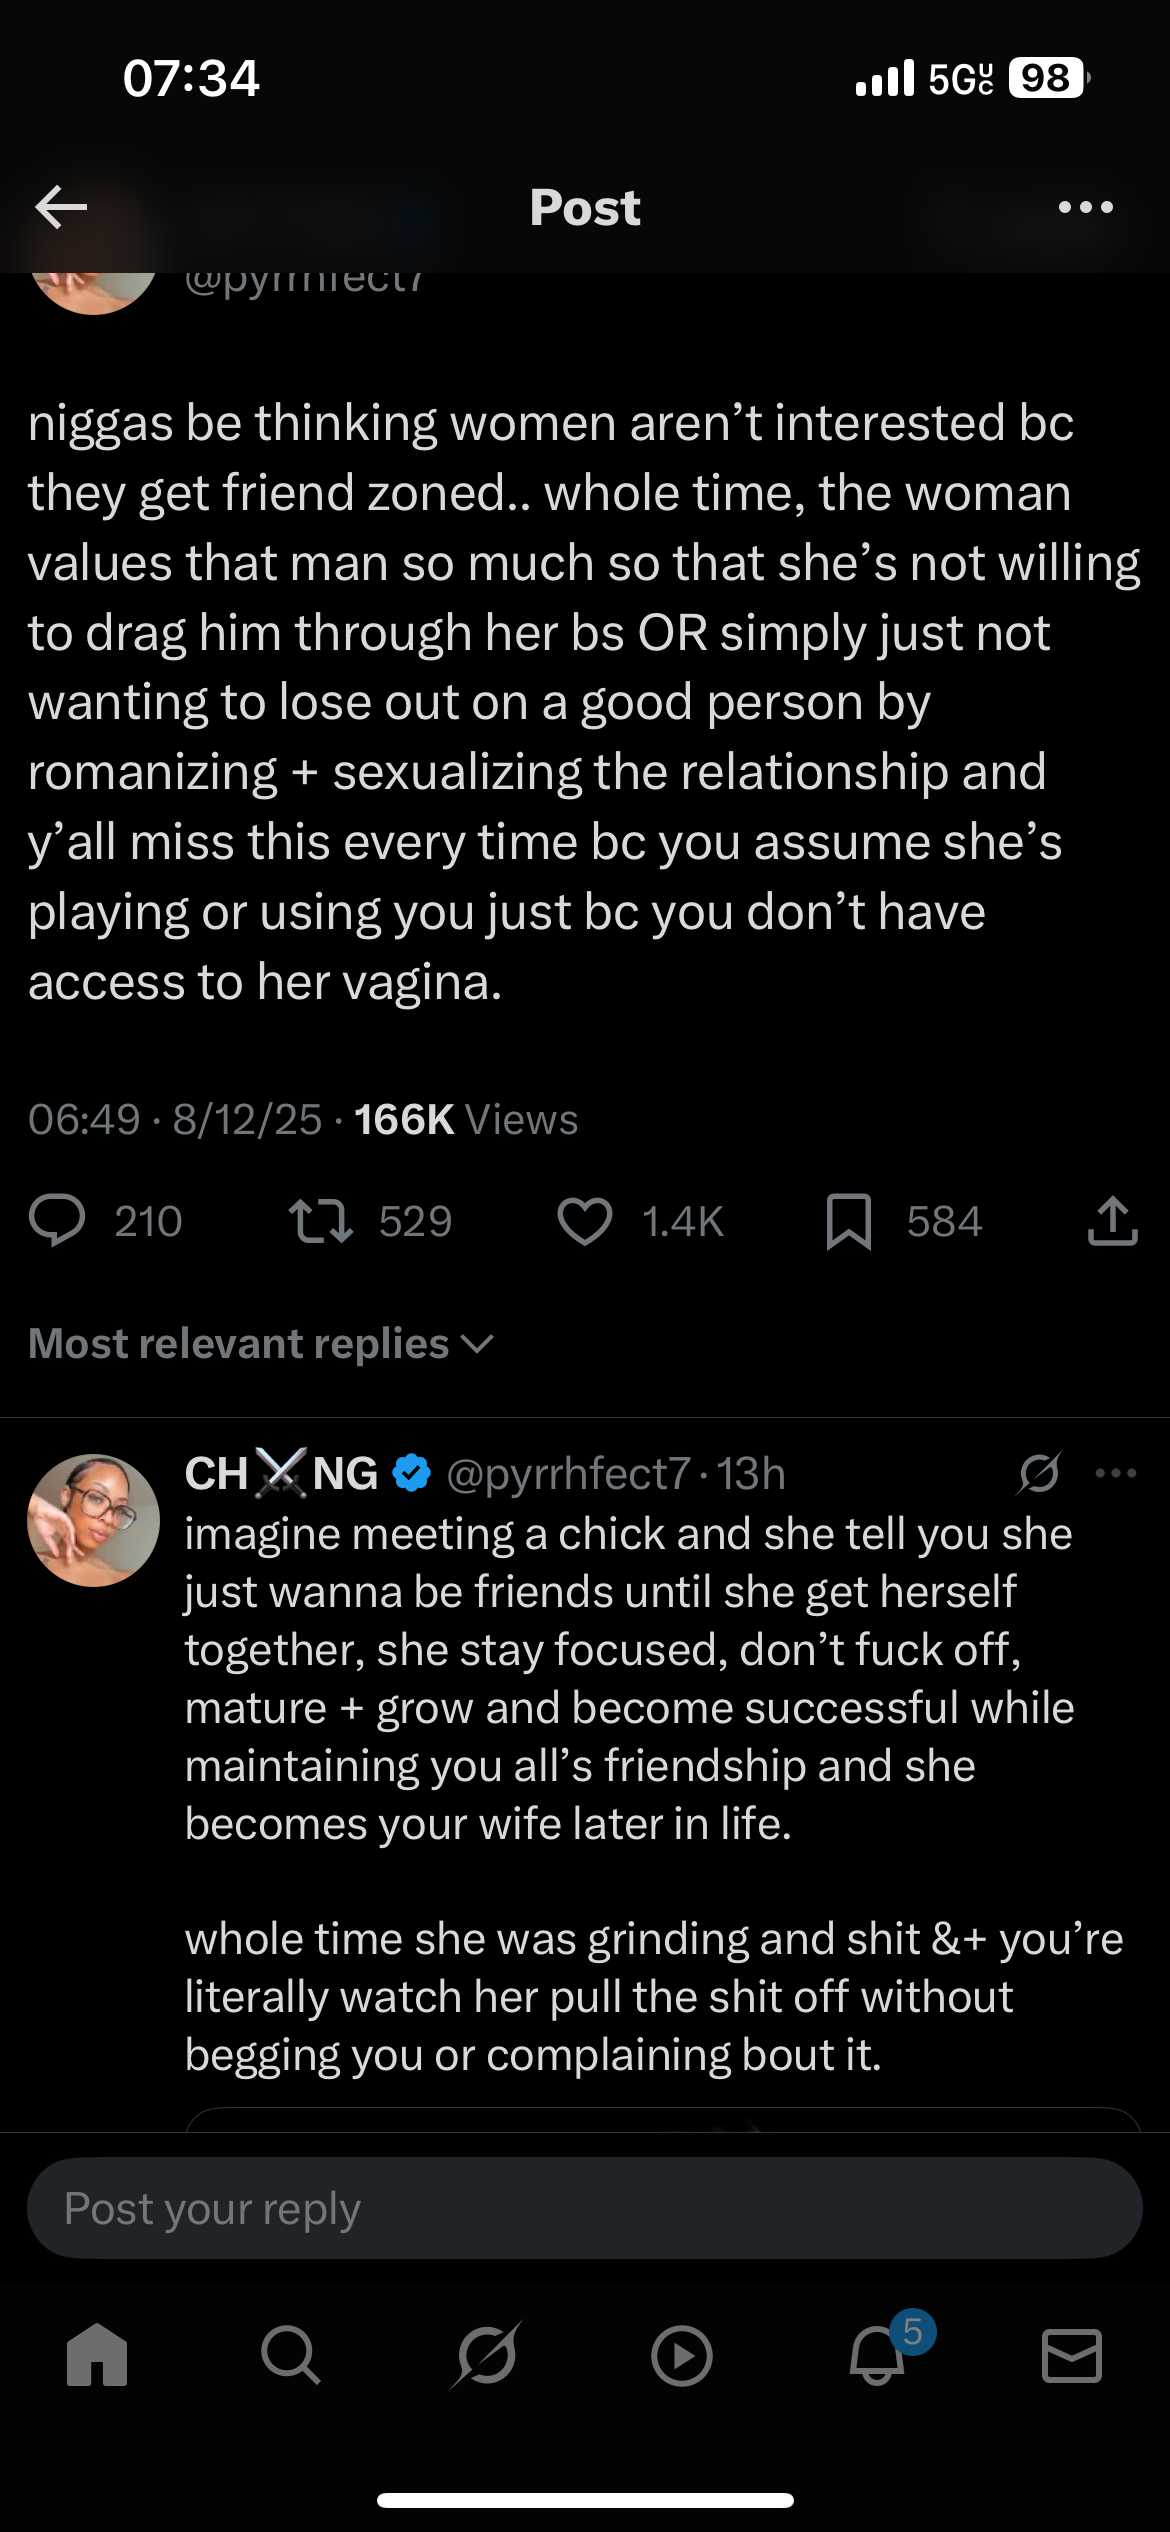
Bish please. I just want some ass 😂save the chicken bawk for the next niggy
https://x.com/pyrrhfect7/status/1955235167922163940?s=46

Interested? Want to learn more about the community?
What else you may like…
Videos
Posts
00:00:08
Starting May 12, 2025 The After Pill Begins! 30 straight days of CGA IRL. Evenings only on Twitch. twitch.tv
00:00:22
00:00:15

I’ve been struggling to understand why the markets seem to shake off everything—terrible economy, bad macro setup, commodity prices, etc., and just keep going up.
Then I created this chart, which may explain that we are not (yet) in a real bubble and there is still a ways to go.
S&P to Gold ratio over the last 100 years. The log chart makes it looks a bit more bubbly but in reality we are not close to the historical popping points.
I may have to change some thinking…
Good luck